Exeter Energy Recovery Facility: Difference between revisions
Arctellion (talk | contribs) No edit summary |
No edit summary |
||
| Line 14: | Line 14: | ||
==Local Authority Users== | ==Local Authority Users== | ||
The following | The following represents those local authorities recorded as putting tonnage into the site (either directly or via a transfer station). The tonnage received cannot be directly compared with the stated historical tonnage received and recorded in the [[EA]] statistics as these are recorded on a calendar year basis (i.e. January 2018 to December 2018). A 'zero return' below indicates no local authority tonnage was recorded, most likely a result of the plant being recently commissioned and actually having received no tonnage. Equally, lower than expected tonnage maybe a result of either a new plant being in 'ramp up' towards full capacity after construction, or may be a result of plant shut down and subsequent re-start in a year. | ||
{{#clear_external_data:}} | {{#clear_external_data:}} | ||
{{#get_db_data: db=engy | {{#get_db_data: db=engy | ||
Revision as of 12:59, 17 December 2020

| Exeter Energy Recovery Facility Operational | |
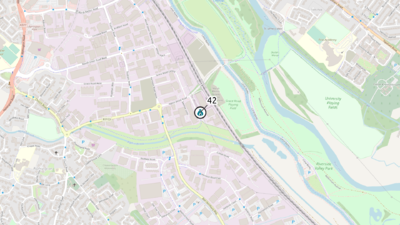
 See Residual EfW → page for a larger UK Wide map. | |
| Waste Licence | HP3538CR |
| Operator | Paprec Energies Cyclerval Ltd |
| Region | South West |
| Operational Capacity | 60ktpa |
| Is site R1? | fal |
| When was R1 Granted? | |
| What was the R1 value | 0.00 |
| Electrical Capacity | 13.00MWe |
| Number of Lines | 1 |
| Number of Turbines | 1 |
| CHP | No |
| Technology Approach | EfW |
| Funding Type | PPP |
Operators Annual Report
Input Data
| Year | HH | C&I | Clin | RDF | Total |
|---|---|---|---|---|---|
| 2016 | 0.00 | 0.00 | 0.00 | 0.00 | 0.00 |
| 2017 | 55685.00 | 0.00 | 0.00 | 0.00 | 55685.00 |
| 2018 | 57986.00 | 0.00 | 0.00 | 0.00 | 57986.00 |
| 2019 | 58256.00 | 0.00 | 0.00 | 0.00 | 58256.00 |
| 2020 | 60219.00 | 0.00 | 0.00 | 0.00 | 60219.00 |
| 2021 | 59688.00 | 0.00 | 0.00 | 0.00 | 59688.00 |
| 2022 | 59751.00 | 0.00 | 0.00 | 0.00 | 59751.00 |
| 2023 | 62732.00 | 0.00 | 0.00 | 0.00 | 62732.00 |
Output Data
| Year | IBA | IBA %ge of Tot IN | APC | APC %ge of Tot IN |
|---|---|---|---|---|
| 2016 | 9236.50 | 0.00% | 2384.00 | 0.00% |
| 2017 | 10617.06 | 19.07% | 2463.82 | 4.42% |
| 2018 | 10303.00 | 17.77% | 2419.00 | 4.17% |
| 2019 | 10036.00 | 17.23% | 2312.00 | 3.97% |
| 2020 | 10659.00 | 17.70% | 2386.00 | 3.96% |
| 2021 | 10289.00 | 17.24% | 2045.00 | 3.43% |
| 2022 | 10340.00 | 17.31% | 2089.00 | 3.50% |
| 2023 | 11363.00 | 18.11% | 2142.00 | 3.41% |
Summary
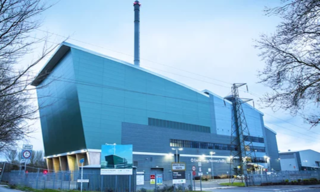
An EfW facility based upon conventional combustion technology and not considered an ERF as yet based upon it not having R1 status. Exeter has permitted operational capacity of 60,000 tonnes per annum, owned by Viridor and operated for them by Cyclerval for the first 5 years of its life. Delivery of waste is by road and the facility processes primarily residual Household Waste[1].
History
The Exeter facility was built primarily to service a PPP contract with Devon, servicing primarily Exeter City Council with anticipated total throughput of up to 60,000 tonnes per annum.
Plant
Built by TIRU SA (now part of Dalkia[2], part of the EDF Group) under a Design & Build EPC-turnkey contract which was delivered and operational in July 2014 at a reported [3] £47m capital cost. The plant comprises of one line with a design capacity capable of treating 60,000 tonnes per annum via standard combustion technology comprising an oscillating kiln, generating super-heated steam, and is configured to run on primarily residual Household Waste. Power output design is reported is 4MWe, but electrical capacity is shown as 13MWe.
Local Authority Users
The following represents those local authorities recorded as putting tonnage into the site (either directly or via a transfer station). The tonnage received cannot be directly compared with the stated historical tonnage received and recorded in the EA statistics as these are recorded on a calendar year basis (i.e. January 2018 to December 2018). A 'zero return' below indicates no local authority tonnage was recorded, most likely a result of the plant being recently commissioned and actually having received no tonnage. Equally, lower than expected tonnage maybe a result of either a new plant being in 'ramp up' towards full capacity after construction, or may be a result of plant shut down and subsequent re-start in a year.
| Authority | Tonnage |
|---|
