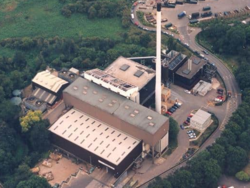
Coventry EfW Plant: Difference between revisions
Imported from text file |
m add picture and link |
||
| Line 1: | Line 1: | ||
[[File:Coventry.png|250px|left|CSWDC Coventry]] | |||
[[Category:EfW Plants]][[Category:Tonnage & Waste Types]][[Category:Technologies & Solutions]] | [[Category:EfW Plants]][[Category:Tonnage & Waste Types]][[Category:Technologies & Solutions]] | ||
{{EfWTemplate|EPR=NP3739PD|id=17}} | {{EfWTemplate|EPR=NP3739PD|id=17}} | ||
Revision as of 13:51, 7 February 2020

| Coventry EfW Plant Operational | |
 See Residual EfW → page for a larger UK Wide map. | |
| Waste Licence | NP3739PD |
| Operator | CSWDC |
| Region | West Midlands |
| Operational Capacity | 315ktpa |
| Is site R1? | fal |
| When was R1 Granted? | |
| What was the R1 value | 0.00 |
| Electrical Capacity | 17.70MWe |
| Number of Lines | 3 |
| Number of Turbines | 2 |
| CHP | Yes |
| Technology Approach | EfW |
| Funding Type | PPP |
Operators Annual Report
Input Data
| Year | HH | C&I | Clin | RDF | Total |
|---|---|---|---|---|---|
| 2016 | 0.00 | 0.00 | 0.00 | 0.00 | 0.00 |
| 2017 | 0.00 | 0.00 | 0.00 | 0.00 | 0.00 |
| 2018 | 288537.70 | 0.00 | 0.00 | 0.00 | 288976.00 |
| 2019 | 298854.00 | 0.00 | 0.00 | 0.00 | 298854.00 |
| 2020 | 309224.00 | 0.00 | 0.00 | 0.00 | 313268.00 |
| 2021 | 291351.00 | 0.00 | 0.00 | 0.00 | 295135.00 |
| 2022 | 297511.00 | 0.00 | 0.00 | 0.00 | 297821.00 |
| 2023 | 291310.00 | 0.00 | 0.00 | 0.00 | 291805.00 |
Output Data
| Year | IBA | IBA %ge of Tot IN | APC | APC %ge of Tot IN |
|---|---|---|---|---|
| 2016 | 45992.00 | 0.00% | 10924.00 | 0.00% |
| 2017 | 45176.00 | 0.00% | 10384.00 | 0.00% |
| 2018 | 44216.00 | 15.30% | 10450.00 | 3.62% |
| 2019 | 44064.00 | 14.74% | 11660.00 | 3.90% |
| 2020 | 48141.00 | 15.37% | 12905.00 | 4.12% |
| 2021 | 42617.00 | 14.44% | 11344.00 | 3.84% |
| 2022 | 43365.00 | 14.56% | 11846.00 | 3.98% |
| 2023 | 44623.00 | 15.29% | 12311.00 | 4.22% |
