Eastcroft EfW (Lines 1 & 2): Difference between revisions
Imported from text file |
Arctellion (talk | contribs) No edit summary |
||
| Line 9: | Line 9: | ||
==Local Authority Users== | ==Local Authority Users== | ||
The following data comes from [[WasteDataFlow]] for the financial year 2018/19 and represents those local authorities recorded as putting tonnage into the site (either directly or via a transfer station). The tonnage received cannot be directly compared with the stated historical tonnage received and recorded in the [[EA]] statistics as these are recorded on a calendar year basis (i.e. January 2018 to December 2018). A 'zero return' below indicates no local authority tonnage was recorded, most likely a result of the plant being recently commissioned and actually having received no tonnage. Equally, lower than expected tonnage maybe a result of either a new plant being in 'ramp up' towards full capacity after construction, or may be a result of plant shut down and subsequent re-start in a year. | |||
{{#clear_external_data:}} | |||
{{#get_db_data: db=engy | |||
|from=wdfincin|where=epr='EP3034SN'|data=authority=authority,epr=epr,ton=ton}} | |||
{|class="wikitable sortable" | |||
! Authority | |||
! Tonnage {{#for_external_table:<nowiki/> | |||
{{!}}- | |||
{{!}} [[{{{authority}}}]] | |||
{{!}} {{{ton}}} | |||
}} | |||
|} | |||
==References== | ==References== | ||
<references /> | <references /> | ||
Revision as of 09:44, 20 February 2020
| Eastcroft EfW (Lines 1 & 2) Operational | |
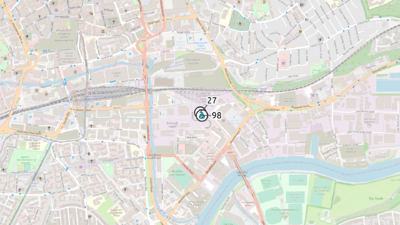
 See Residual EfW → page for a larger UK Wide map. | |
| Waste Licence | EP3034SN |
| Operator | FCC Environment (WasteNotts) |
| Region | East Midlands |
| Operational Capacity | 200ktpa |
| Is site R1? | fal |
| When was R1 Granted? | |
| What was the R1 value | 0.00 |
| Electrical Capacity | 9.00MWe |
| Number of Lines | 2 |
| Number of Turbines | 0 |
| CHP | Yes |
| Technology Approach | EfW |
| Funding Type | PPP |
Operators Annual Report
Input Data
| Year | HH | C&I | Clin | RDF | Total |
|---|---|---|---|---|---|
| 2016 | 162540.71 | 7303.29 | 0.00 | 0.00 | 169844.00 |
| 2017 | 143359.81 | 7323.15 | 0.00 | 0.00 | 150682.95 |
| 2018 | 167348.47 | 9248.53 | 0.00 | 0.00 | 176597.00 |
| 2019 | 188117.00 | 96.00 | 0.00 | 0.00 | 188213.00 |
| 2020 | 191092.00 | 10.00 | 0.00 | 0.00 | 191102.00 |
| 2021 | 166944.00 | 19059.00 | 0.00 | 0.00 | 186003.00 |
| 2022 | 161633.00 | 20515.00 | 0.00 | 0.00 | 182148.00 |
| 2023 | 164628.00 | 20659.00 | 0.00 | 0.00 | 185287.00 |
Output Data
| Year | IBA | IBA %ge of Tot IN | APC | APC %ge of Tot IN |
|---|---|---|---|---|
| 2016 | 34403.24 | 20.26% | 4911.14 | 2.89% |
| 2017 | 29304.00 | 19.45% | 3899.00 | 2.59% |
| 2018 | 35312.00 | 20.00% | 4488.00 | 2.54% |
| 2019 | 36654.00 | 19.47% | 4728.00 | 2.51% |
| 2020 | 37544.00 | 19.65% | 4400.00 | 2.30% |
| 2021 | 36250.00 | 19.49% | 4194.00 | 2.25% |
| 2022 | 34259.00 | 18.81% | 3926.00 | 2.16% |
| 2023 | 35400.00 | 19.11% | 4338.00 | 2.34% |
Summary
History
Plant
Local Authority Users
The following data comes from WasteDataFlow for the financial year 2018/19 and represents those local authorities recorded as putting tonnage into the site (either directly or via a transfer station). The tonnage received cannot be directly compared with the stated historical tonnage received and recorded in the EA statistics as these are recorded on a calendar year basis (i.e. January 2018 to December 2018). A 'zero return' below indicates no local authority tonnage was recorded, most likely a result of the plant being recently commissioned and actually having received no tonnage. Equally, lower than expected tonnage maybe a result of either a new plant being in 'ramp up' towards full capacity after construction, or may be a result of plant shut down and subsequent re-start in a year.
| Authority | Tonnage |
|---|---|
| Derby City Council | 2096.030 |
| Derbyshire County Council | 6439.780 |
| Nottingham City Council | 90060.030 |
| Nottinghamshire County Council | 74413.160 |
| Rutland County Council | 9350.640 |
