Widermerpool Biomass Power Plant: Difference between revisions
No edit summary |
No edit summary |
||
| Line 5: | Line 5: | ||
==Summary== | ==Summary== | ||
to add | |||
==Plant== | ==Plant== | ||
to add | |||
{{BioSustain|EPR={{#var: epr}}}} | {{BioSustain|EPR={{#var: epr}}}} | ||
Revision as of 08:08, 15 August 2022
| Widermerpool Biomass Power Plant Operational | |
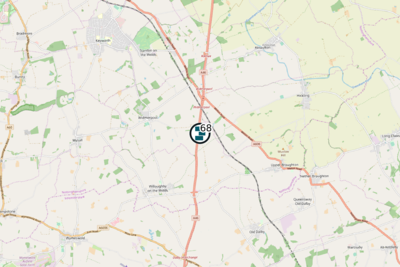
 See Biomass EfW → page for a larger UK Wide map. | |
| Operator | Equitix ESI CHP (Nottingham) Ltd |
| Capacity | 6.7 MWe |
| Feedstock | Waste Wood |
| EPR (Waste Licence) | QP3936AX |
| ROC | Yes |
| CfD | |
| CHP | Yes |
Operators Annual Report
Input Data
| Year | Wood | Litter | RDF | Other | Total |
|---|---|---|---|---|---|
| 2018 | 25107 | 0 | 0 | 0 | 25107 |
| 2019 | 48730 | 0 | 0 | 0 | 48730 |
| 2020 | 53373 | 0 | 0 | 0 | 53373 |
| 2021 | 49199 | 0 | 0 | 0 | 49199 |
| 2022 | 49135 | 0 | 0 | 0 | 49135 |
Output Data
| Year | IBA | IBA %ge of Tot IN | APC | APC %ge of Tot IN |
|---|---|---|---|---|
| 2018 | 855 | 3.41% | 269 | 1.07% |
| 2019 | 1497 | 3.07% | 468 | 0.96% |
| 2020 | 2131 | 3.99% | 617 | 1.16% |
| 2021 | 1774 | 3.60% | 662 | 1.34% |
| 2022 | 2146 | 4.37% | 600 | 1.22% |
Summary
to add
Plant
to add
Annual Sustainability Tonnage Input/Fuel
The tonnage[1] received by the plant in the most recent Annual Sustainability Report and for the previous 3 years for 2020/21 was reported by Ofgem as below[2]:
| Year | Waste Wood (m3) | Waste Wood (t) | Straw | Miscanthus | Arboricultrual Waste | Sawmill Residue | Foresrty Residue | Round Wood | Short Rotation Coppice | MBM | Other Material |
|---|---|---|---|---|---|---|---|---|---|---|---|
| 2020/21 | 0 | 40207 | 0 | 0 | 0 | 0 | 0 | 0 | 0 | 0 | 0 |
| 2019/20 | 0 | 45708 | 0 | 0 | 0 | 0 | 0 | 0 | 0 | 0 | 0 |
| 2018/19 | 0 | 29017 | 0 | 0 | 0 | 0 | 0 | 0 | 0 | 0 | 0 |
| 2017/18 | 0 | 0 | 0 | 0 | 0 | 0 | 0 | 0 | 0 | 0 | 0 |
Waste Tonnage, By Origin
The table shows a list of the Waste for the Permit QP3936AX, that has arrived into sites as reported to the Regulator and then publicised in their reported statistics. The Data was last updated on Oct-24. The total reported tonnage arriving at the site was: 52,029.62t.
Where this tonnage exceeds that reported in year of the corresponding annual report, this may be due to the following reasons:
- Tonnage may have been received but not incinerated, i.e. the material is held pending incineration (the operator return to the EA reports as received whereas the annual report focuses on when the waste is incinerated.)
- Material may have been received into the site but treated in some other way than incineration.
- Material may have been received on the but transferred out of site for disposal/treatment at another site rather than incineration on the site.
| EWC Code | Origin of Waste | Tonnes In |
|---|---|---|
| 19 12 07 | Nottinghamshire | 48438.4 |
| 19 12 07 | Sheffield | 3591.22 |
References
- ↑ In the case of EfW plants with gasification technology the figures are reported in terms of cubic metres of syngas produced rather than tonnes used
- ↑ Biomass Sustainability Dataset 2020-21
