Twinwoods Heat & Power CHP
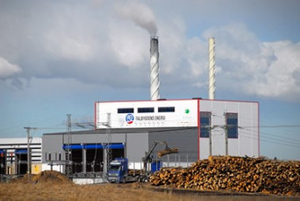
A Biomass Waste EFW facility Twinwoods Heat & Power CHP is based on processing c.40,000 tonnes per annum of Wood Waste generating 3.4MWe to the grid[1]. The permitted capacity of the plant is 32,500 tonnes per annum and the permit was extended in 2018 to enable it to receive hazardous Wood Waste.
| Twinwoods Heat & Power CHP Operational | |
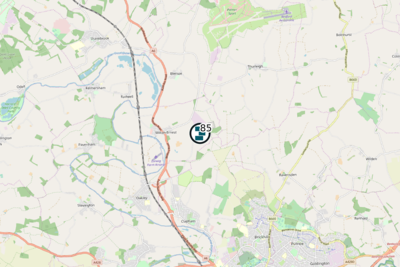
 See Biomass EfW → page for a larger UK Wide map. | |
| Operator | Twinwoods Heat & Power Ltd |
| Capacity | 3.6 MWe |
| Feedstock | Waste Wood |
| EPR (Waste Licence) | SP3638KV |
| ROC | Yes |
| CfD | |
| CHP | Unkwn |
Operators Annual Report
Input Data
| Year | Wood | Litter | RDF | Other | Total |
|---|---|---|---|---|---|
| 2020 | 22388 | 0 | 0 | 0 | 26248 |
| 2021 | 24256 | 0 | 0 | 0 | 27594 |
| 2022 | 17566 | 0 | 0 | 93 | 21023 |
Output Data
| Year | IBA | IBA %ge of Tot IN | APC | APC %ge of Tot IN |
|---|---|---|---|---|
| 2018 | 661 | 0.00% | 458 | 0.00% |
| 2019 | 267 | 0.00% | 200 | 0.00% |
| 2020 | 1336 | 5.09% | 244 | 0.93% |
| 2021 | 1378 | 4.99% | 297 | 1.08% |
| 2022 | 1152 | 5.48% | 158 | 0.75% |

Summary
A Biomass Waste EFW facility Twinwoods Heat & Power CHP is based on processing c.40,000 tonnes per annum of Wood Waste generating 3.4MWe to the grid. The permitted capacity of the plant is 32,500 tonnes per annum and the permit was extended in 2018 to enable it to receive hazardous Wood Waste.
The Twinwoods site was developed by Twinwoods Heat and Power Ltd (a company established to develop the project on from the original developer B&W Waste Management) and was originally a joint venture between Bioflame and Growing Beds. After raising capital from Star Capital is was completed in 2015 after originally starting in 2009[2]. It is located in Twinwoods Industrial Park in Bedfordshire.
Plant
The project was originally based on equipment supply and delivery by Bioflame, but after going into administration in 2011 it was taken up by Saxlund International who changed the arrangements, using their combustion grate technology[3] similar to the Falbygden Biomass plant in Sweden. The plant is WID complaint.
Annual Sustainability Tonnage Input/Fuel
The tonnage[4] received by the plant in the most recent Annual Sustainability Report and for the previous 3 years for 2020/21 was reported by Ofgem as below[5]:
| Year | Waste Wood (m3) | Waste Wood (t) | Straw | Miscanthus | Arboricultrual Waste | Sawmill Residue | Foresrty Residue | Round Wood | Short Rotation Coppice | MBM | Other Material |
|---|---|---|---|---|---|---|---|---|---|---|---|
| 2020/21 | 0 | 26152 | 0 | 0 | 0 | 0 | 0 | 0 | 0 | 0 | 0 |
| 2019/20 | 0 | 21001 | 0 | 0 | 0 | 0 | 0 | 0 | 0 | 0 | 0 |
| 2018/19 | 0 | 19519 | 0 | 0 | 0 | 0 | 0 | 0 | 0 | 0 | 0 |
| 2017/18 | 0 | 0 | 0 | 0 | 0 | 0 | 0 | 0 | 0 | 0 | 0 |
Waste Tonnage, By Origin
The table shows a list of the Waste for the Permit SP3638KV, that has arrived into sites as reported to the Regulator and then publicised in their reported statistics. The Data was last updated on Oct-24. The total reported tonnage arriving at the site was: 19,397.09t.
Where this tonnage exceeds that reported in year of the corresponding annual report, this may be due to the following reasons:
- Tonnage may have been received but not incinerated, i.e. the material is held pending incineration (the operator return to the EA reports as received whereas the annual report focuses on when the waste is incinerated.)
- Material may have been received into the site but treated in some other way than incineration.
- Material may have been received on the but transferred out of site for disposal/treatment at another site rather than incineration on the site.
| EWC Code | Origin of Waste | Tonnes In |
|---|---|---|
| 15 02 02* | Bedford | 44.83 |
| 15 02 02* | Nottinghamshire | 957.8 |
| 17 02 01 | London | 22.2 |
| 17 02 01 | Windsor and Maidenhead | 2.02 |
| 17 02 04* | Bedford | 217.06 |
| 17 02 04* | Exeter | 33.88 |
| 17 02 04* | Luton | 24.92 |
| 17 02 04* | North Norfolk | 3.48 |
| 17 02 04* | Outside UK | 634.76 |
| 17 02 04* | Surrey | 1.97 |
| 17 02 04* | Wales | 10.42 |
| 19 12 06* | Bristol, City of | 7.52 |
| 19 12 06* | Cambridgeshire | 10.42 |
| 19 12 06* | Cheshire East | 2303.4 |
| 19 12 06* | County Durham | 2.02 |
| 19 12 06* | Dorset | 77.52 |
| 19 12 06* | Norfolk | 18 |
| 19 12 06* | Northamptonshire | 338.72 |
| 19 12 06* | Outside UK | 650.25 |
| 19 12 06* | South East | 61.18 |
| 19 12 06* | Swansea | 33.5 |
| 19 12 06* | Wales | 97.96 |
| 19 12 06* | Wiltshire | 22 |
| 19 12 06* | Yorks & Humber | 3074.83 |
| 19 12 07 | Bedford | 10264.12 |
| 20 01 37* | Bedford | 292.85 |
| 20 01 37* | Dorset | 71.24 |
| 20 01 37* | London | 38.66 |
| 20 01 38 | Swansea | 79.56 |
The plant utilizes hazardous Wood Waste from the rail network and other commercial and industrial sources.
References
- ↑ Star Capital Website
- ↑ Letsrecycle Article
- ↑ Connecting Industry Article
- ↑ In the case of EfW plants with gasification technology the figures are reported in terms of cubic metres of syngas produced rather than tonnes used
- ↑ Biomass Sustainability Dataset 2020-21
