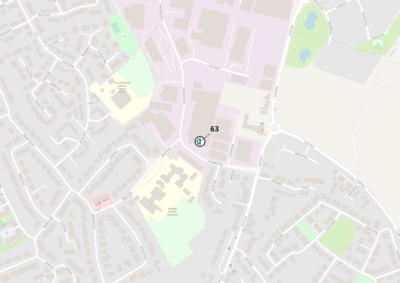
Units 3-5
| Units 3-5 | |
| Hills Waste Solutions Ltd | |
 See Qualifying MRF → page for a larger UK Wide map. | |
| Tonnage Summary | |
| Data | 2020 |
|---|---|
| EA Tonnage IN | Expression error: Unexpected round operator. |
| EA Tonnage OUT | Expression error: Unexpected round operator. |
| Qualifying IN | 3,143.23 |
| Qualifying OUT | 2,968.7 |
Summary
Text to be added
History
Text to be added
Plant
Text to be added
Permit Tonnage Received (IN)
Total Tonnage by EWC Code
The table shows a list of the Waste for the Permit 103018, that has arrived into sites as reported to the Regulator and then publicised in their reported statistics. The Data used is the most current. The total reported tonnage arriving at the site was: 0t.
| EWC Code | Description | Tonnes In |
|---|
Total Tonnage by Origin of EWC Code
The table below shows the same data as the table above, but split according to the origin of each EWC code waste stream entering into the site as reported to the Regulator.
| EWC Code | Origin of Waste | Tonnes In |
|---|
Permit Tonnage Sent Out (OUT)
The table shows a list of the Waste for the Permit 103018, that has left the site as reported to the Regulator and then publicised in their reported statistics. The Data used is the most current. The total reported tonnage arriving at the site was: 0t.
| EWC Code | Description | Tonnes In |
|---|
Qualifying MRF Tonnage Received
During 2020 the site received 3,143t as qualifying material, as broken down below.
| Quarter | Supplier | Tonnage | Number of Samples | Total Samples Weight (kg) | Glass (%) | Metal (%) | Paper (%) | Plastic (%) | Overall (%) | Non Target Material (%) | Non Recycleable Material (%) |
|---|---|---|---|---|---|---|---|---|---|---|---|
| Jan-Mar | HWS Ltd | 193.00 | 3 | 183.00 | 0.00 | 0.33 | 70.00 | 16.59 | 86.93 | 6.66 | 6.41 |
| Jan-Mar | Wiltshire | 2950.23 | 27 | 1721.00 | 0.00 | 0.00 | 79.05 | 16.35 | 88.68 | 4.50 | 6.82 |
Qualifying MRF Tonnage Sent Out
During 2020 the site removed2,969t of qualifying material, as broken down below.
| Quarter | Material | Tonnage | Number of Samples | Total Samples Weight | Target Material (%) | Non Target Material (%) | Non Recycleable Material (%) |
|---|---|---|---|---|---|---|---|
| Jan-Mar | Paper | 1376.96 | 23 | 1299.00 | 94.08 | 2.81 | 3.11 |
| Jan-Mar | Plastic | 702.48 | 47 | 1164.00 | 82.99 | 13.34 | 3.67 |
| Jan-Mar | Paper | 698.96 | 12 | 702.00 | 95.57 | 1.10 | 3.33 |
| Jan-Mar | Plastic | 190.30 | 13 | 366.00 | 80.05 | 13.90 | 6.05 |
