UK Waste Tonnage
The total waste arisings per year for the UK reported by DEFRA in September 2024 was for core data reported for 2020 [1] and was 191.2 million tonnes, with 85% of that tonnage arising from England. This is a decrease of 14% on the figures reported for 2018 (data for England is available for 2022 and this indicates an increase of tonnage from 2020 to 2022 of c.17%) .
Headline Figures
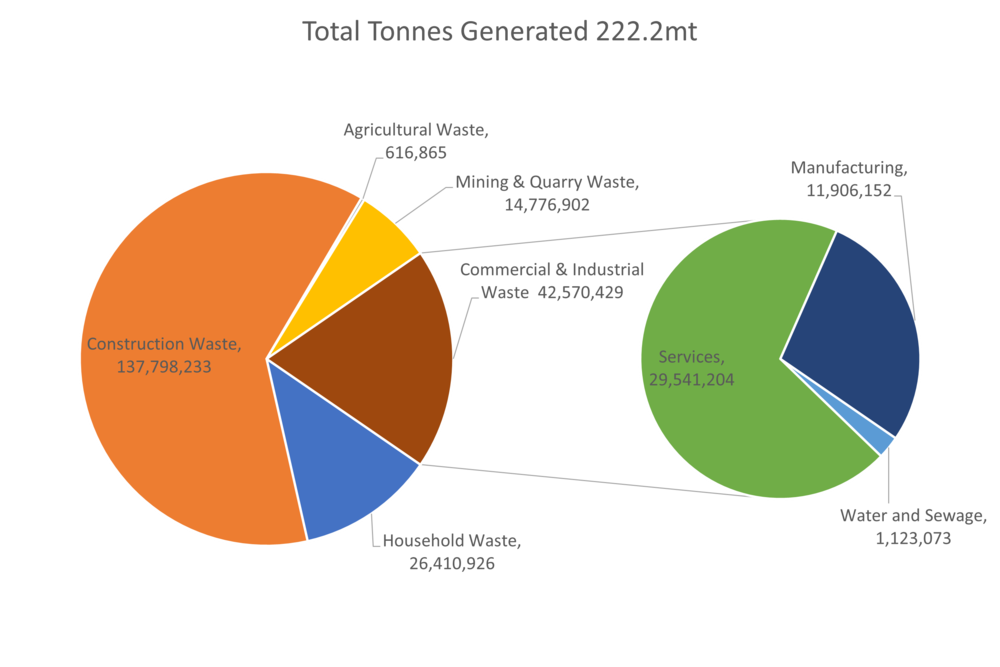
The macro-level data reported in 2024 by DEFRA for tonnage arisings is summarised in the figure below (produced by Monksleigh from the raw DEFRA data), with a total of 191.2 million tonnes of waste arising in the UK (with England responsible for 85% of the total):

The waste mix in 2020 is summarised in the extract from DEFRA below:

Key Destination Information
- Recycling and Recovery : around 97.3 million tonnes was recycled or recovered (52.3%) in 2020 of which around two thirds are mineral and soil wastes (down 10.3% on 2018)
- Energy Recovery : around 9.7 million tonnes was used for energy recovery based on 2020 data (classified by DEFRA as those sites which have R1 status, those without are reported as Incineration)
- Landfill : around 45 million tonnes (23.6%) of waste went to landfill in 2020 (down 11% on 2018)
- Waste Derived Fuel Export : not reported, but previously reported at around 3.2 million tonnes of RDF or SRF was sent outside of the UK for energy recovery (the majority to the Netherlands, Germany and Sweden) this tonnage has more than halved since 2018 (see Waste Derived Fuel)
Performance against Key Targets
- The UK recycling rate for waste from households was 44.6% in 2023 vs 44.1% in 2022 [2] against an historic EU target of 50% by 2020.
| Country | 2017 | 2018 | 2019 | 2020 | 2021 | 2022 | 2023 |
|---|---|---|---|---|---|---|---|
| England | 45.2% | 44.7% | 45.5% | 44.0% | 44.1% | 43.4% | 44.0% |
| Northern Ireland | 46.3% | 47.7% | 50.6% | 49.1% | 48.4% | 49.2% | 50.2% |
| Scotland | 43.5% | 42.8% | 43.5% | 41.0% | 41.7% | 42.0% | 42.1% |
| Wales | 55.2% | 54.1% | 56.4% | 56.5% | 56.7% | 56.9% | 57.0% |
| UK Total | 45.5% | 45.0% | 46.0% | 44.4% | 44.6% | 44.1% | 44.6% |
- The UK C&D recovery rate was 92.6% in 2020 (against an historic EU target of 70% by 2020) equivalent to recovering around around 55 million tonnes of the 59.4 million tonnes classified as non-hazardous C&D wastes. The recovery rates for 2021 and 2022 were 93.6% and 94.3% respectively.
- The UK BMW to Landfill has fallen from around 6.3 million tonnes in 2022 to 5.3 million tonnes in 2023.
- The UK packaging waste either recycled or recovered was confirmed at 64.1% in 2024.
References
- ↑ UK Statistics on Waste September 2024 update
- ↑ Figures include the metal from IBA
