Waste Collection West Midlands: Difference between revisions

From Wikiwaste
Arctellion (talk | contribs)
No edit summary
No edit summary
Line 2: Line 2:


==Waste Collection Authorities West Midlands==
[[File:WestMidlands dis.png|500px|right]]
[[File:WestMidlands dis.png|500px|right]]
 
{{#clear_external_data:}}
{{#get_db_data: db=ID |from=wca_wm |data=id=id,authority=authority,kgpp=kgpp,recyc=recyc}}
{|class="wikitable sortable"
!ID
!Authority
!Metric Kg/pp
!Metric Recycling{{#for_external_table:<nowiki/>
{{!}}-
{{!}} {{{id}}}
{{!}} [[{{{authority}}}]]
{{!}} {{{kgpp}}}
{{!}} {{{recyc}}}
}}
|}
<br clear='all' />
<br clear='all' />
==Waste Disposal Authorities West Midlands==
[[File:WestMids wad.png|500px|right]]
[[File:WestMids wad.png|500px|right]]
 
{{#clear_external_data:}}
{{#get_db_data: db=ID |from=wda_wm |data=id=id,authority=authority,kgpp=kgpp,recyc=recyc}}
{|class="wikitable sortable"
!ID
!Authority
!Metric Kg/pp
!Metric Recycling{{#for_external_table:<nowiki/>
{{!}}-
{{!}} {{{id}}}
{{!}} [[{{{authority}}}]]
{{!}} {{{kgpp}}}
{{!}} {{{recyc}}}
}}
|}
<br clear = "all" />

Revision as of 11:47, 18 October 2021

Local Authorities in the West Midlands of England are 'two tier' in structure having Waste Collection Authorities and Waste Disposal Authorities as separate entities.

Waste Collection Authorities West Midlands


ID Authority Metric Kg/pp Metric Recycling
318 Worcester City Council 431.4 35.0
319 Redditch Borough Council 521.5 27.4
317 Malvern Hills District Council 393.1 41.3
270 Rugby Borough Council 430.1 43.2
3 Birmingham City Council 656.1 22.9
39 Coventry City Council 550.1 30.5
279 Wyre Forest District Council 483.9 33.1
272 Nuneaton and Bedworth Borough Council 501.7 35.4
255 Tamworth Borough Council 518.0 35.4
271 Warwick District Council 359.9 53.4
17 Sandwell MBC 626.7 29.2
252 Newcastle-under-Lyme Borough Council 417.1 45.8
348 Wychavon District Council 448.5 43.2
253 East Staffordshire Borough Council 504.3 38.6
139 Herefordshire Council 481.2 37.6
280 Bromsgrove District Council 501.5 41.2
251 Lichfield District Council 455.7 44.3
4 Dudley MBC 542.7 35.5
250 South Staffordshire Council 468.6 43.9
38 Wolverhampton MBC 549.4 36.6
254 Cannock Chase Council 488.7 40.1
329 Stafford Borough Council 449.4 44.6
316 Stratford-on-Avon District Council 319.6 60.0
28 Walsall MBC 620.8 32.8
249 Staffordshire Moorlands District Council 384.2 53.2
56 Stoke-on-Trent City Council 555.9 33.7
269 North Warwickshire Borough Council 557.5 37.0
20 Solihull MBC 541.4 41.5
97 Telford and Wrekin Council 529.3 48.2
88 Shropshire 502.0 52.1


Waste Disposal Authorities West Midlands
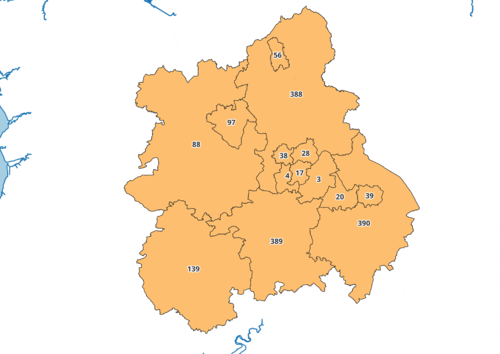

ID Authority Metric Kg/pp Metric Recycling
3 Birmingham City Council 656.1 22.9
39 Coventry City Council 550.1 30.5
17 Sandwell MBC 626.7 29.2
139 Herefordshire Council 481.2 37.6
4 Dudley MBC 542.7 35.5
38 Wolverhampton MBC 549.4 36.6
28 Walsall MBC 620.8 32.8
56 Stoke-on-Trent City Council 555.9 33.7
390 Warwickshire County Council 449.8 48.0
20 Solihull MBC 541.4 41.5
389 Worcestershire County Council 547.9 42.1
388 Staffordshire County Council 548.8 43.9
97 Telford and Wrekin Council 529.3 48.2
88 Shropshire 502.0 52.1