UK Waste Tonnage: Difference between revisions
m updated references |
No edit summary |
||
| Line 5: | Line 5: | ||
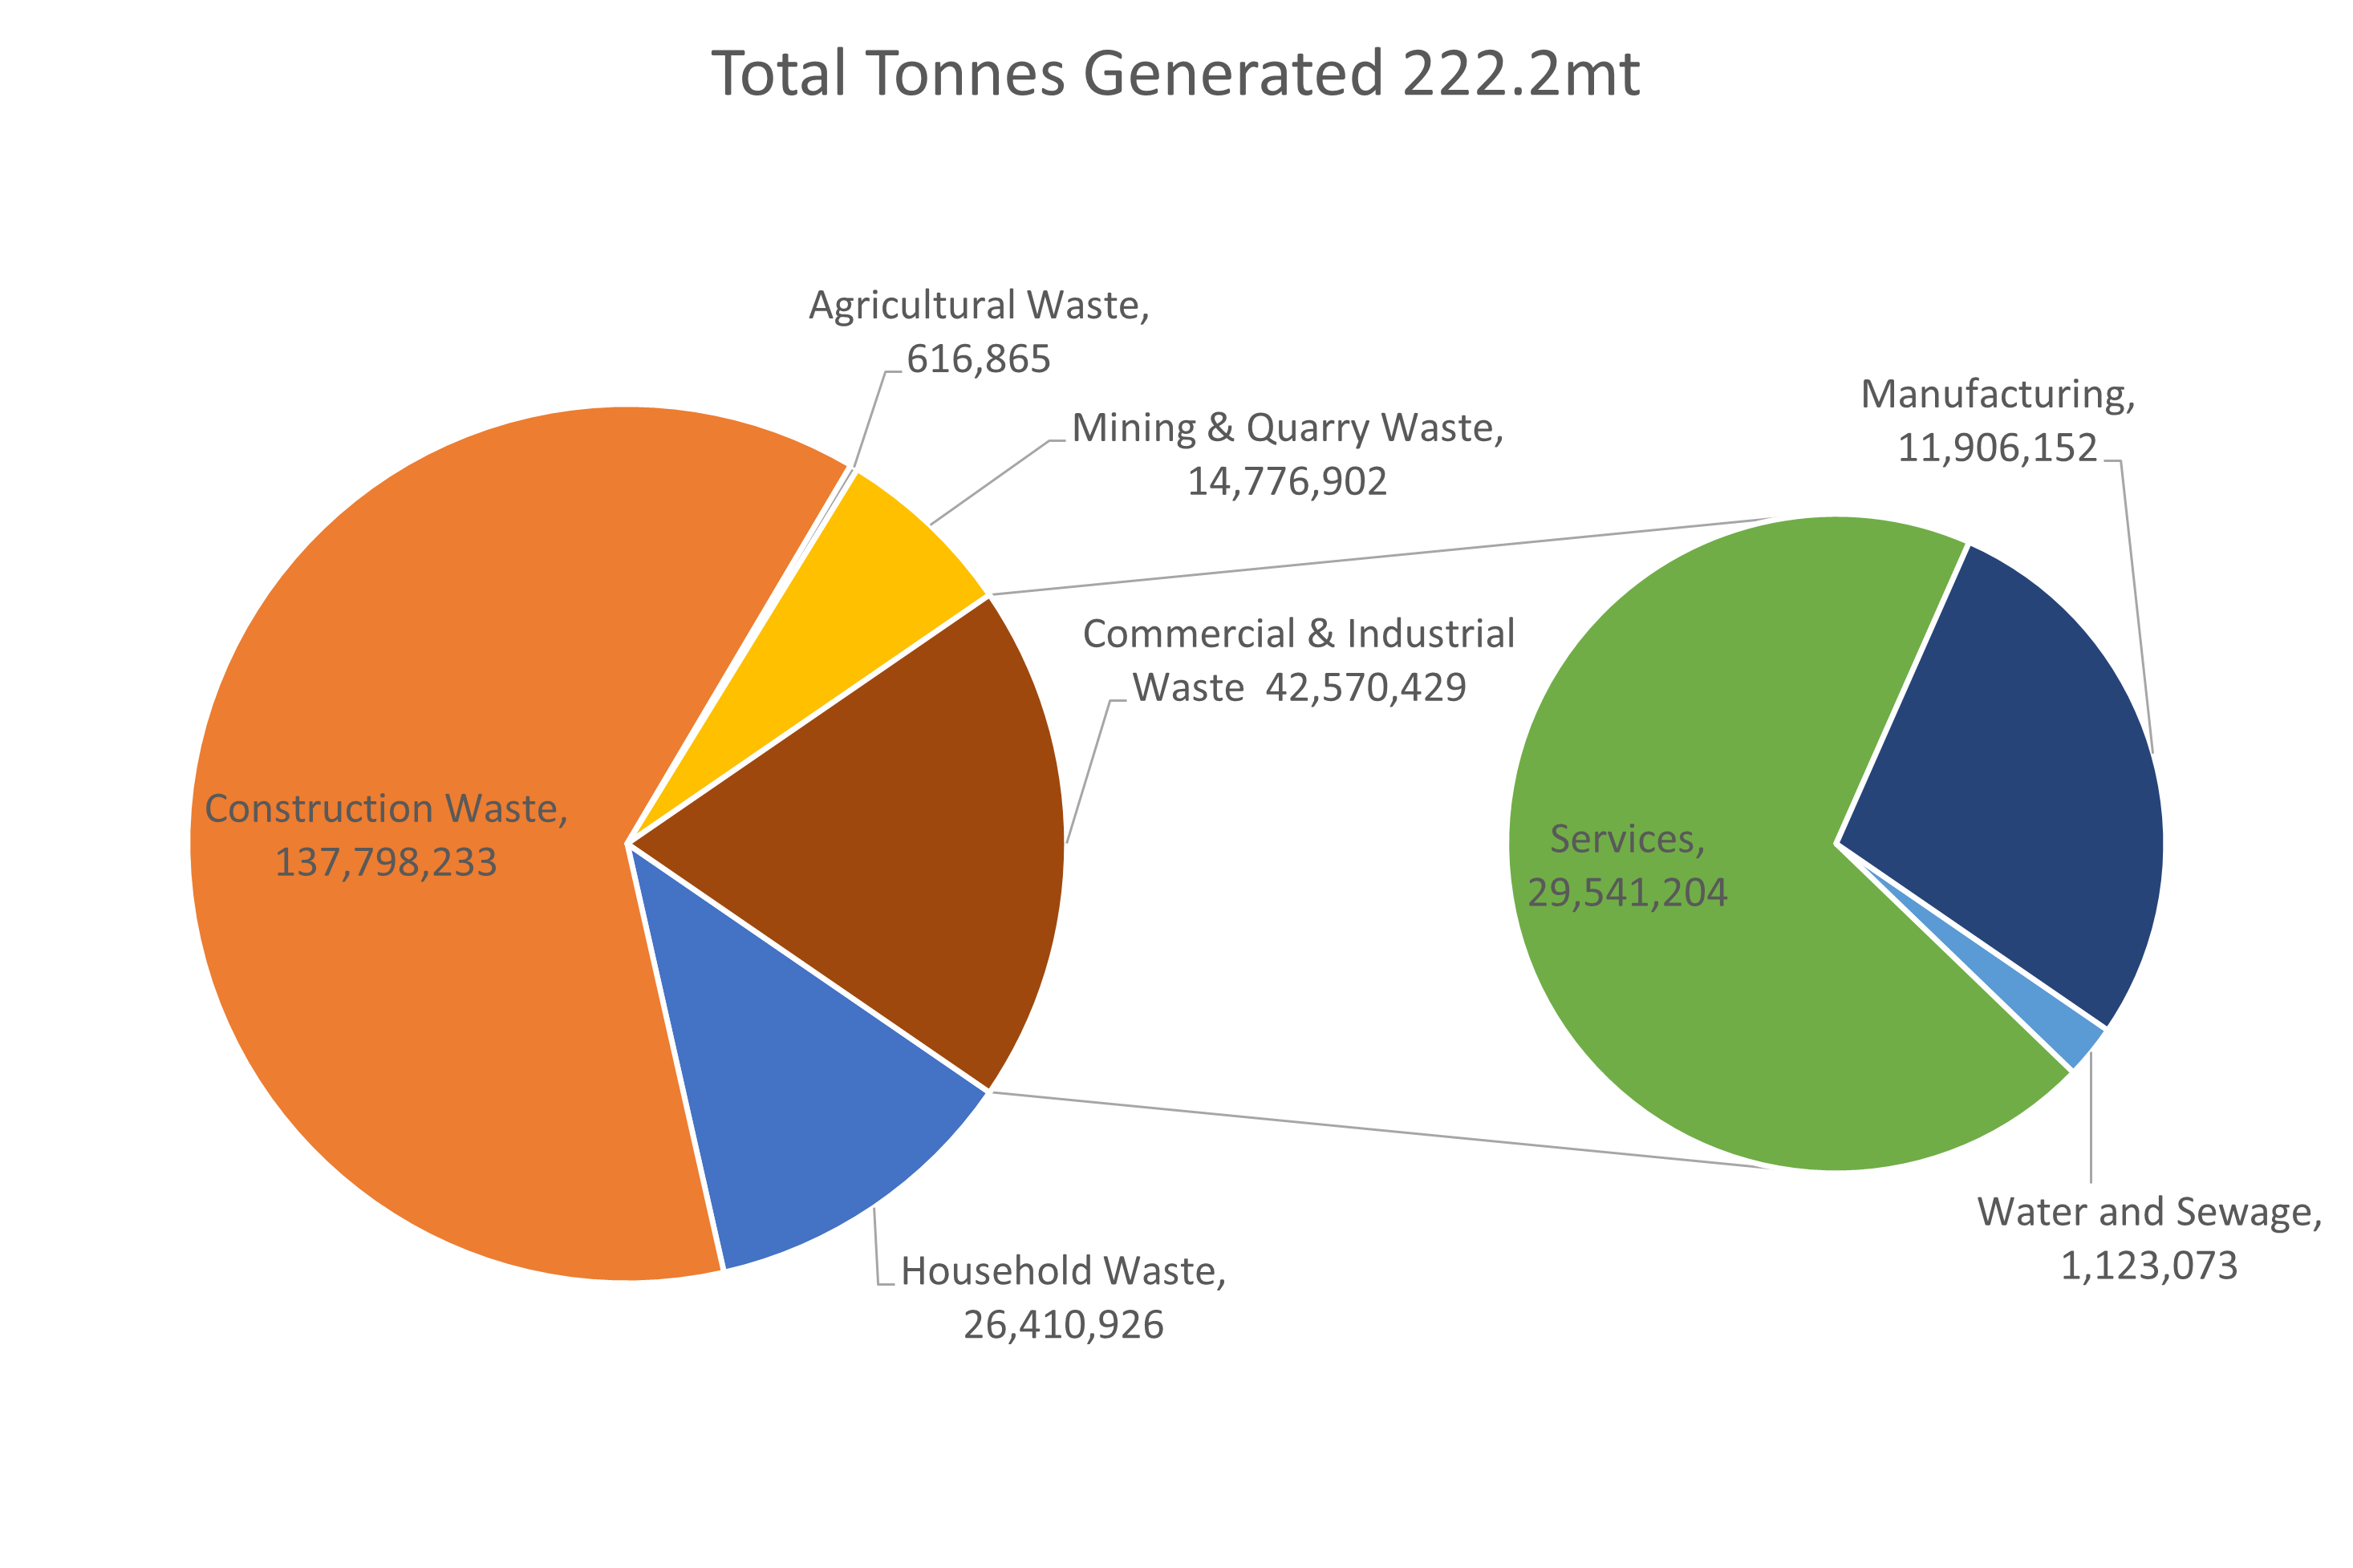
The most recent macro-level data reported in 2019 by [[DEFRA]] for tonnage arisings is summarised in the figure below, with a total of nearly 223 million tonnes of waste arising in the UK (with England responsible for 85% of the total): | The most recent macro-level data reported in 2019 by [[DEFRA]] for tonnage arisings is summarised in the figure below, with a total of nearly 223 million tonnes of waste arising in the UK (with England responsible for 85% of the total): | ||
[[File:UK Macro Tonnage Graphic.png|frame|centre|UK Waste Tonnage Summary]] | |||
| Line 18: | Line 20: | ||
* [[Energy Recovery]] : around 7.3 million tonnes was used for energy recovery (4 times the figure in 2014 of 1.9 million tonnes) of which 76% was household and similar wastes | * [[Energy Recovery]] : around 7.3 million tonnes was used for energy recovery (4 times the figure in 2014 of 1.9 million tonnes) of which 76% was household and similar wastes | ||
* [[Landfill]] : around 52 million tonnes (24.4%) of waste went to landfill in 2016 | * [[Landfill]] : around 52 million tonnes (24.4%) of waste went to landfill in 2016 | ||
* [[Waste Derived Fuel]] Export : around 3.2 million tonnes of RDF or SRF was sent outside of the UK for energy recovery (the majority to the Netherlands, Germany and Sweden) | * [[Waste Derived Fuel]] Export : around 3.2 million tonnes of [[RDF]] or [[SRF]] was sent outside of the UK for energy recovery (the majority to the Netherlands, Germany and Sweden) | ||
== Performance against Key Targets == | == Performance against Key Targets == | ||
Revision as of 18:30, 11 November 2019
The total waste arisings per year for the UK in the most recent DEFRA data [1] [2]was almost 223 million tonnes, with 85% of that tonnage arising from England.
Headline Figures
The most recent macro-level data reported in 2019 by DEFRA for tonnage arisings is summarised in the figure below, with a total of nearly 223 million tonnes of waste arising in the UK (with England responsible for 85% of the total):

- around 81 million tonnes was mineral Waste (17m from mining and quarrying and 63 million from construction) and 58.7 million tonnes was soils (primarily from construction), the two largest waste categories in the UK (63% of the total)
- around 69 million tonnes was controlled wastes and 67.8 million HIC (Household, Industrial and Commercial wastes 31% of the total)
- around 27.3 million tonnes was waste arisings from households (22.8 million tonnes was from England equivalent to 412kg per person)
- around 41 million tonnes [3] was Commercial and Industrial Waste or C&I (of which around 33 million tonnes or 80% was generated in England)
- around 10 million tonnes [4] of food and drink was waste in the food chain in 2015 (equivalent to around 25% of the 41 million tonnes of food bought)
Key Destination Information
- Recycling and Recovery : around 104 million tonnes (48.5%) was recycled or recovered in 2016 (55% of which was mineral wastes and 12% soils)
- Energy Recovery : around 7.3 million tonnes was used for energy recovery (4 times the figure in 2014 of 1.9 million tonnes) of which 76% was household and similar wastes
- Landfill : around 52 million tonnes (24.4%) of waste went to landfill in 2016
- Waste Derived Fuel Export : around 3.2 million tonnes of RDF or SRF was sent outside of the UK for energy recovery (the majority to the Netherlands, Germany and Sweden)
Performance against Key Targets
- The UK recycling rate for households was 45.7% up from 45.2% in 2016 (against an EU target of 50% by 2020)
- England 45.2%
- Northern Ireland 46.3%
- Scotland 43.5%
- Wales 57.6%
- The UK C&D recycling rate was 91% (against an EU target of 70% by 2020) equivalent to recycling around around 60 million of the 66 million tonnes classified as non-hazardous C&D wastes
- The UK BMW to Landfill was 21% of the baseline 1995 value in 2017 (the EU target is 35% of the 1995 baseline by 2020) equivalent to 7.4 million tonnes (against the target of 11.8 million tonnes, 4.4 million tonnes improvement on the target)
- The UK packaging waste either recycled or recovered was 71.4% in 2017 (the EU target is to exceed 60%) equivalent to 8 million tonnes
- ↑ Digest of Waste Resources 2018 reporting data from 2016
- ↑ UK Statistics on Waste 2019 updating some of the 2018 Digest with 2017 data
- ↑ with latest estimates DEFRA estimates of 37.9 million tonnes in 2017
- ↑ with around 60% thought to be avoidable
