Ridham Biomass Power Plant
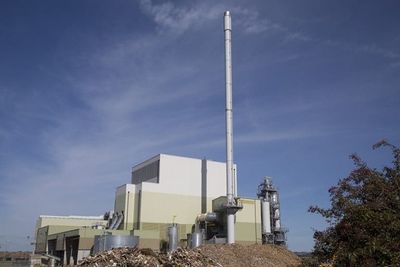
A Combined Heat and Power (CHP) Biomass EfW facility Ridham Biomass Power Plant is based on consuming up to 172,000 tonnes per annum of Wood Waste to produce 23 MW power to be exported to the national grid.
| Ridham Biomass Power Plant Operational | |
 See Biomass EfW → page for a larger UK Wide map. | |
| Operator | MVV Environment Ridham Ltd |
| Capacity | 25.42 MWe |
| Feedstock | Waste Wood |
| EPR (Waste Licence) | TP3536CL |
| ROC | Yes |
| CfD | |
| CHP | Yes |
Operators Annual Report
Input Data
| Year | Wood | Litter | RDF | Other | Total |
|---|---|---|---|---|---|
| 2017 | 143751 | 0 | 0 | 2438 | 146189 |
| 2018 | 177041 | 0 | 0 | 0 | 177041 |
| 2019 | 148602 | 0 | 0 | 0 | 148602 |
| 2020 | 185432 | 0 | 0 | 0 | 185432 |
| 2021 | 177247 | 0 | 0 | 0 | 177247 |
| 2022 | 154069 | 0 | 0 | 0 | 154069 |
Output Data
| Year | IBA | IBA %ge of Tot IN | APC | APC %ge of Tot IN |
|---|---|---|---|---|
| 2017 | 7398 | 5.06% | 1623 | 1.11% |
| 2018 | 9707 | 5.48% | 1763 | 1.00% |
| 2019 | 8254 | 5.55% | 1467 | 0.99% |
| 2020 | 12652 | 6.82% | 2109 | 1.14% |
| 2021 | 11078 | 6.25% | 1947 | 1.10% |
| 2022 | 9194 | 5.97% | 1767 | 1.15% |

Summary
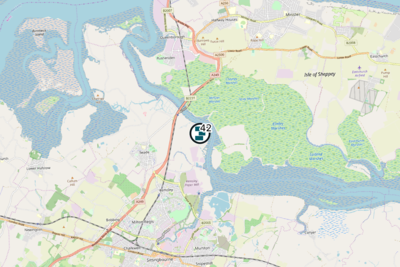
A Combined Heat and Power (CHP) Biomass EfW facility Ridham Biomass Power Plant is based on consuming up to 172,000 tonnes per annum of Wood Waste to produce 23 MW power to be exported to the national grid. The heat that is produced is either fed into the district heating network or is used as process steam for industrial processes. The facility is located at Ridham Dock near Sittingbourne in the county of Kent.
The facility was developed and continues to be operated by MVV Environment, becoming fully operational in November 2016[1].
Plant
The facility cost approximately £126 million to develop[1].
MVV Environment acted also as the EPC contractor for this project, the design of the facility comprises of 1 stream process with air cooling grate[2].
Annual Sustainability Tonnage Input/Fuel
The tonnage[3] received by the plant in the most recent Annual Sustainability Report and for the previous 3 years for 2020/21 was reported by Ofgem as below[4]:
| Year | Waste Wood (m3) | Waste Wood (t) | Straw | Miscanthus | Arboricultrual Waste | Sawmill Residue | Foresrty Residue | Round Wood | Short Rotation Coppice | MBM | Other Material |
|---|---|---|---|---|---|---|---|---|---|---|---|
| 2020/21 | 0 | 186932 | 0 | 0 | 0 | 0 | 0 | 0 | 0 | 0 | 0 |
| 2019/20 | 0 | 139326 | 0 | 0 | 0 | 0 | 0 | 0 | 0 | 0 | 0 |
| 2018/19 | 0 | 173604 | 0 | 0 | 0 | 0 | 0 | 0 | 0 | 0 | 0 |
| 2017/18 | 0 | 0 | 0 | 0 | 0 | 0 | 0 | 0 | 0 | 0 | 0 |
Waste Tonnage, By Origin
The table shows a list of the Waste for the Permit TP3536CL, that has arrived into sites as reported to the Regulator and then publicised in their reported statistics. The Data was last updated on October 2023. The total reported tonnage arriving at the site was: 154,088.01t. Where this tonnage exceeds that reported in year of the corresponding annual report, this may be due to the following reasons:
- Tonnage may have been received but not incinerated, i.e. the material is held pending incineration (the operator return to the EA reports as received whereas the annual report focuses on when the waste is incinerated.)
- Material may have been received into the site but treated in some other way than incineration.
- Material may have been received on the but transferred out of site for disposal/treatment at another site rather than incineration on the site.
| EWC Code | Origin of Waste | Tonnes In |
|---|---|---|
| 17 02 01 | Swale | 14117.66 |
| 17 02 01 | Sevenoaks | 273.00 |
| 19 12 07 | Surrey Heath | 639.54 |
| 19 12 07 | Merton | 99.20 |
| 19 12 07 | Maidstone | 459.28 |
| 19 12 07 | Buckinghamshire | 25.08 |
| 15 01 03 | Swale | 135.00 |
| 17 02 01 | Lambeth | 23.30 |
| 20 01 38 | Hastings | 2303.10 |
| 20 01 38 | Bournemouth, Christchurch and Poole | 158.62 |
| 19 12 07 | Milton Keynes | 87.22 |
| 17 02 01 | Eastbourne | 1351.95 |
| 19 12 07 | Tunbridge Wells | 1.98 |
| 19 12 07 | Central Bedfordshire | 16.82 |
| 20 01 38 | Oxford | 129.72 |
| 19 12 07 | Sevenoaks | 1372.00 |
| 15 01 03 | Dover | 5.74 |
| 17 02 01 | Tonbridge and Malling | 9.28 |
| 17 02 01 | Merton | 3722.72 |
| 19 12 07 | West Berkshire | 197.28 |
| 19 12 07 | South Oxfordshire | 97.20 |
| 17 02 01 | Harrow | 16.70 |
| 19 12 07 | Essex | 1527.00 |
| 17 02 01 | Canterbury | 65.12 |
| 20 01 38 | Canterbury | 315.42 |
| 19 12 07 | Dartford | 6852.12 |
| 15 01 03 | Ashford | 1.58 |
| 19 12 07 | Hounslow | 98.60 |
| 19 12 07 | Dover | 7.70 |
| 17 02 01 | Oxford | 78.28 |
| 15 01 03 | Maidstone | 0.84 |
| 19 12 07 | Wealden | 336.58 |
| 19 12 07 | Windsor and Maidenhead | 18.04 |
| 19 12 07 | Tonbridge and Malling | 490.30 |
| 19 12 07 | North Hertfordshire | 247.46 |
| 20 01 38 | Sevenoaks | 4.84 |
| 20 01 38 | Maidstone | 9049.68 |
| 20 01 38 | Slough | 567.00 |
| 19 12 07 | Ashford | 7240.88 |
| 20 01 38 | Buckinghamshire | 17.58 |
| 17 02 01 | Milton Keynes | 46.26 |
| 20 01 38 | Dartford | 7.84 |
| 17 02 01 | Kent | 2334.00 |
| 17 02 01 | Medway | 364.24 |
| 19 12 07 | Thurrock | 19.30 |
| 17 02 01 | Crawley | 3238.57 |
| 17 02 01 | Brighton and Hove | 207.56 |
| 17 02 01 | Hammersmith and Fulham | 8983.00 |
| 20 01 38 | Tonbridge and Malling | 989.04 |
| 17 02 01 | Reigate and Banstead | 2972.00 |
| 17 02 01 | Greenwich | 645.74 |
| 19 12 07 | Lambeth | 432.68 |
| 15 01 03 | Kent | 39.40 |
| 20 01 38 | Windsor and Maidenhead | 20.22 |
| 19 12 07 | Greenwich | 6816.76 |
| 17 02 01 | Ashford | 1335.98 |
| 20 01 38 | Kent | 231.00 |
| 20 01 38 | Bromley | 8302.20 |
| 17 02 01 | Enfield | 3234.98 |
| 19 12 07 | Kent | 2749.30 |
| 17 02 01 | Basingstoke and Deane | 26.38 |
| 19 12 07 | Hastings | 35.66 |
| 19 12 07 | Croydon | 1940.16 |
| 20 01 38 | West Berkshire | 373.14 |
| 20 01 38 | Greenwich | 494.64 |
| 19 12 07 | Slough | 6682.30 |
| 17 02 01 | South Oxfordshire | 22.96 |
| 19 12 07 | Reigate and Banstead | 22.00 |
| 20 01 38 | Basingstoke and Deane | 293.40 |
| 19 12 07 | North Warwickshire | 17.66 |
| 17 02 01 | Dartford | 3328.76 |
| 20 01 38 | Welwyn Hatfield | 5.66 |
| 17 02 01 | Maidstone | 294.72 |
| 17 02 01 | East Sussex | 1536.00 |
| 20 01 38 | Thanet | 2186.46 |
| 17 02 01 | Thurrock | 40.70 |
| 17 02 01 | Wealden | 13.58 |
| 15 01 03 | Thanet | 1.92 |
| 19 12 07 | Brentwood | 262.38 |
| 17 02 01 | Tunbridge Wells | 48.12 |
| 17 02 01 | Hastings | 189.92 |
| 19 12 07 | Oxford | 39.14 |
| 17 02 01 | Thanet | 18.84 |
| 19 12 07 | Medway | 90.16 |
| 17 02 01 | Bromley | 600.66 |
| 17 02 01 | City of London | 88.12 |
| 17 02 01 | Bedford | 49.14 |
| 19 12 07 | Canterbury | 30.20 |
| 20 01 38 | Medway | 52.28 |
| 15 01 03 | Bromley | 32.00 |
| 19 12 07 | City of London | 1473.74 |
| 20 01 38 | Ashford | 64.86 |
| 19 12 07 | Crawley | 52.76 |
| 19 12 07 | Gravesham | 38.06 |
| 20 01 38 | Swale | 22862.86 |
| 17 02 01 | Dover | 3.84 |
| 19 12 07 | Swale | 10457.47 |
| 17 02 01 | Hounslow | 413.30 |
| 17 02 01 | Surrey Heath | 342.66 |
| 20 01 38 | Dover | 5.54 |
| 19 12 07 | Bromley | 2741.46 |
| 17 02 01 | Slough | 1682.92 |
The Wood Waste tonnage received is locally sourced and comprises of Category B and Category C Wood Waste that cannot be reused, such as processed wood, wood with a low to medium degree of contamination such as chipboard, fibreboard and old furniture, and wood from the construction and demolition of buildings[2].
References
- ↑ 1.0 1.1 Lets Recycle, 2016. MVV Opens Ridham Dock Waste Wood Biomass Plant. Online. letsrecycle.com. [Accessed 22 April 2020.
- ↑ 2.0 2.1 MVV, 2020. About Our Plant - MVV Energie AG. Online. MVV Energie AG(Accessed 22 April 2020)
- ↑ In the case of EfW plants with gasification technology the figures are reported in terms of cubic metres of syngas produced rather than tonnes used
- ↑ Biomass Sustainability Dataset 2020-21
