Baldovie and Dundee EfW: Difference between revisions
Arctellion (talk | contribs) No edit summary |
No edit summary |
||
| Line 21: | Line 21: | ||
==Local Authority Users== | ==Local Authority Users== | ||
The following | The following represents those local authorities recorded as putting tonnage into the site (either directly or via a transfer station). The tonnage received cannot be directly compared with the stated historical tonnage received and recorded in the [[EA]] statistics as these are recorded on a calendar year basis (i.e. January 2018 to December 2018). A 'zero return' below indicates no local authority tonnage was recorded, most likely a result of the plant being recently commissioned and actually having received no tonnage. Equally, lower than expected tonnage maybe a result of either a new plant being in 'ramp up' towards full capacity after construction, or may be a result of plant shut down and subsequent re-start in a year. | ||
{{#clear_external_data:}} | {{#clear_external_data:}} | ||
{{#get_db_data: db=engy | {{#get_db_data: db=engy | ||
Revision as of 12:59, 17 December 2020

| Baldovie and Dundee EfW Operational | |
 See Residual EfW → page for a larger UK Wide map. | |
| Waste Licence | PPC/A/1003157 |
| Operator | MVV Environmental Baldovie Ltd |
| Region | Scotland |
| Operational Capacity | 260ktpa |
| Is site R1? | fal |
| When was R1 Granted? | |
| What was the R1 value | 0.00 |
| Electrical Capacity | 20.00MWe |
| Number of Lines | 3 |
| Number of Turbines | 2 |
| CHP | No |
| Technology Approach | EfW |
| Funding Type | PFI |
Operators Annual Report
Input Data
| Year | HH | C&I | Clin | RDF | Total |
|---|---|---|---|---|---|
| 2016 | 0.00 | 0.00 | 0.00 | 0.00 | 0.00 |
| 2017 | 0.00 | 0.00 | 0.00 | 0.00 | 0.00 |
| 2018 | 0.00 | 0.00 | 0.00 | 0.00 | 0.00 |
| 2019 | 98303.00 | 0.00 | 0.00 | 0.00 | 98303.00 |
| 2020 | 0.00 | 0.00 | 0.00 | 98303.00 | 98303.00 |
| 2021 | 78109.00 | 85090.00 | 0.00 | 0.00 | 163203.00 |
| 2022 | 73085.00 | 109074.00 | 0.00 | 0.00 | 182165.00 |
| 2023 | 102458.00 | 85457.00 | 0.00 | 0.00 | 187915.00 |
Output Data
| Year | IBA | IBA %ge of Tot IN | APC | APC %ge of Tot IN |
|---|---|---|---|---|
| 2016 | 0.00 | 0.00% | 0.00 | 0.00% |
| 2017 | 0.00 | 0.00% | 0.00 | 0.00% |
| 2018 | 0.00 | 0.00% | 0.00 | 0.00% |
| 2019 | 14991.00 | 15.25% | 8224.00 | 8.37% |
| 2020 | 13262.00 | 13.49% | 7053.00 | 7.17% |
| 2021 | 30039.00 | 18.41% | 9632.00 | 5.90% |
| 2022 | 33863.00 | 18.59% | 9299.00 | 5.10% |
| 2023 | 37408.00 | 19.91% | 6465.00 | 3.44% |
Summary
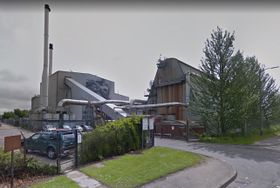
In Nov 2017, MVV entered into a contract with Dundee City Council and Angus Council to take over and operate this existing energy from waste facility whilst building a new, modern facility next door (Dundee EfW CHP Facility).[1].
The facility first began operations in 1994 and receives 120,000 tonnes of waste a year collected from Dundee, Angus and Aberdeenshire areas. The facility primarily accepts Municipal Solid Waste and Household Waste but does allow some Commercial Waste to be treated.
The plant is due to close when the new facility Dundee EfW CHP Facility becomes fully operational.
History
The EFW plant at Baldovie was for many years the only municipal waste fired EfW plant in mainland Scotland. It suffered a major fire in 2012 and was later refurbished at a cost of £13.5m.[2]
It was previously owned and operated by Dundee Energy Recovery Ltd, a local authority owned company and formed part of a PFI with Dundee City Council.
Plant
The incineration process carried out by the plant handles mainly Household Waste and Commercial Waste in two 17 MW thermal input bubbling fluidised bed boilers (which at the time were the first in operation in the UK). The plant generates 10.5 MWe of electrical output with 8.3 MWe exported to the National Grid. The plant is designed to treat 120,000 tonnes of waste per year with each boiler capable of burning waste at a nominal design rate of 7.6 tonnes/hr per boiler.[3]
Local Authority Users
The following represents those local authorities recorded as putting tonnage into the site (either directly or via a transfer station). The tonnage received cannot be directly compared with the stated historical tonnage received and recorded in the EA statistics as these are recorded on a calendar year basis (i.e. January 2018 to December 2018). A 'zero return' below indicates no local authority tonnage was recorded, most likely a result of the plant being recently commissioned and actually having received no tonnage. Equally, lower than expected tonnage maybe a result of either a new plant being in 'ramp up' towards full capacity after construction, or may be a result of plant shut down and subsequent re-start in a year.
| Authority | Tonnage |
|---|
