Eastcroft EfW (Lines 1 & 2): Difference between revisions
Arctellion (talk | contribs) No edit summary |
→Summary: new page |
||
| Line 3: | Line 3: | ||
==Summary== | ==Summary== | ||
An EfW facility based upon conventional combustion technology which is not considered an ERF as a result of not having R1 status. Eastcroft has a permitted operational capacity of 160,000 tonnes per annum, operated over two lines. It is operated by [[FCC Environment]] on behalf [[Nottingham City Council]] and [[Nottinghamshire County Council]]. Delivery of waste is by road from a network of waste transfer stations and the facility processes primarily residual [[Household Waste]] and some [[Commercial Waste]]. | |||
The energy recovery process at Eastcroft generates steam, which is delivered via a pipeline to EnviroEnergy Limited, a company wholly owned by [[Nottingham City Council]]. EnviroEnergy supplies heat to a wide range of customers, including 4,600 domestic premises in the city, as well as public buildings including the Broad Marsh shopping centres, Victoria Baths, Nottingham Trent University’s Newton Building, the Inland Revenue building, the Magistrates Court, Nottingham City Council offices and the National Ice Centre. Any excess steam is also used to generate electricity which powers the facility and is also supplied to many local customers within Nottingham City.<ref>https://www.fccenvironment.co.uk/green-energy/eastcroft/</ref> | |||
==History== | ==History== | ||
Revision as of 14:42, 24 February 2020
| Eastcroft EfW (Lines 1 & 2) Operational | |
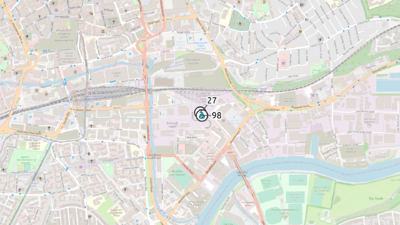
 See Residual EfW → page for a larger UK Wide map. | |
| Waste Licence | EP3034SN |
| Operator | FCC Environment (WasteNotts) |
| Region | East Midlands |
| Operational Capacity | 200ktpa |
| Is site R1? | fal |
| When was R1 Granted? | |
| What was the R1 value | 0.00 |
| Electrical Capacity | 9.00MWe |
| Number of Lines | 2 |
| Number of Turbines | 0 |
| CHP | Yes |
| Technology Approach | EfW |
| Funding Type | PPP |
Operators Annual Report
Input Data
| Year | HH | C&I | Clin | RDF | Total |
|---|---|---|---|---|---|
| 2016 | 162540.71 | 7303.29 | 0.00 | 0.00 | 169844.00 |
| 2017 | 143359.81 | 7323.15 | 0.00 | 0.00 | 150682.95 |
| 2018 | 167348.47 | 9248.53 | 0.00 | 0.00 | 176597.00 |
| 2019 | 188117.00 | 96.00 | 0.00 | 0.00 | 188213.00 |
| 2020 | 191092.00 | 10.00 | 0.00 | 0.00 | 191102.00 |
| 2021 | 166944.00 | 19059.00 | 0.00 | 0.00 | 186003.00 |
| 2022 | 161633.00 | 20515.00 | 0.00 | 0.00 | 182148.00 |
| 2023 | 164628.00 | 20659.00 | 0.00 | 0.00 | 185287.00 |
Output Data
| Year | IBA | IBA %ge of Tot IN | APC | APC %ge of Tot IN |
|---|---|---|---|---|
| 2016 | 34403.24 | 20.26% | 4911.14 | 2.89% |
| 2017 | 29304.00 | 19.45% | 3899.00 | 2.59% |
| 2018 | 35312.00 | 20.00% | 4488.00 | 2.54% |
| 2019 | 36654.00 | 19.47% | 4728.00 | 2.51% |
| 2020 | 37544.00 | 19.65% | 4400.00 | 2.30% |
| 2021 | 36250.00 | 19.49% | 4194.00 | 2.25% |
| 2022 | 34259.00 | 18.81% | 3926.00 | 2.16% |
| 2023 | 35400.00 | 19.11% | 4338.00 | 2.34% |
Summary
An EfW facility based upon conventional combustion technology which is not considered an ERF as a result of not having R1 status. Eastcroft has a permitted operational capacity of 160,000 tonnes per annum, operated over two lines. It is operated by FCC Environment on behalf Nottingham City Council and Nottinghamshire County Council. Delivery of waste is by road from a network of waste transfer stations and the facility processes primarily residual Household Waste and some Commercial Waste.
The energy recovery process at Eastcroft generates steam, which is delivered via a pipeline to EnviroEnergy Limited, a company wholly owned by Nottingham City Council. EnviroEnergy supplies heat to a wide range of customers, including 4,600 domestic premises in the city, as well as public buildings including the Broad Marsh shopping centres, Victoria Baths, Nottingham Trent University’s Newton Building, the Inland Revenue building, the Magistrates Court, Nottingham City Council offices and the National Ice Centre. Any excess steam is also used to generate electricity which powers the facility and is also supplied to many local customers within Nottingham City.[1]
History
Plant
Local Authority Users
The following data comes from WasteDataFlow for the financial year 2018/19 and represents those local authorities recorded as putting tonnage into the site (either directly or via a transfer station). The tonnage received cannot be directly compared with the stated historical tonnage received and recorded in the EA statistics as these are recorded on a calendar year basis (i.e. January 2018 to December 2018). A 'zero return' below indicates no local authority tonnage was recorded, most likely a result of the plant being recently commissioned and actually having received no tonnage. Equally, lower than expected tonnage maybe a result of either a new plant being in 'ramp up' towards full capacity after construction, or may be a result of plant shut down and subsequent re-start in a year.
| Authority | Tonnage |
|---|---|
| Derby City Council | 2096.030 |
| Derbyshire County Council | 6439.780 |
| Nottingham City Council | 90060.030 |
| Nottinghamshire County Council | 74413.160 |
| Rutland County Council | 9350.640 |
