
A national reference for UK waste intelligence
Structured data on UK waste infrastructure, facilities, operators and market activity — built for analysis, benchmarking and decision-making.
How to use this resource
WikiWaste brings together structured data across UK waste infrastructure, organisations, waste streams and market activity. The platform is designed to support rapid navigation between assets, operators and datasets — enabling users to analyse relationships, compare facilities and interpret sector trends efficiently.
Explore the platform directly or review subscription options for full access.
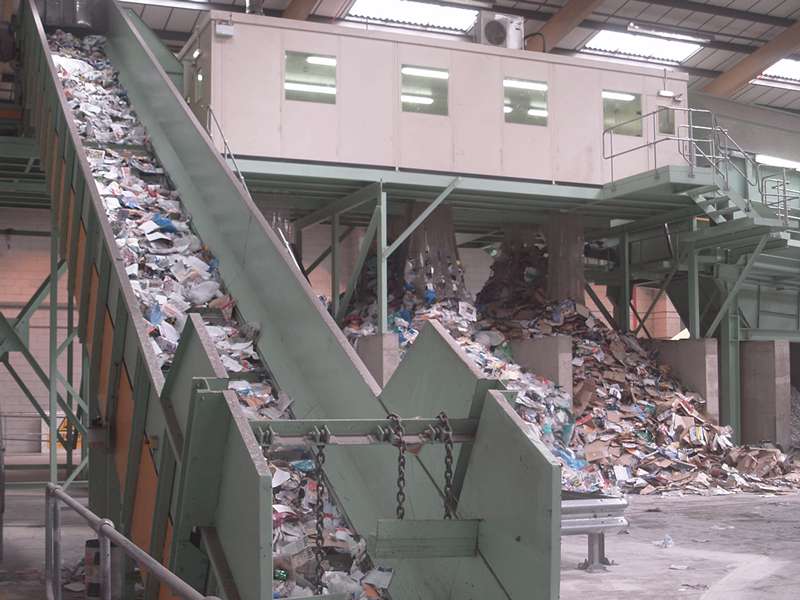
Material Facilities (MFs)
In WikiWaste, MFs are treated as a type of MRF within the wider Material Recovery Facility category.
This page provides a structured view of the MFs in operation across the UK and connects through to each individual facility page and Local Authority treatment routes.
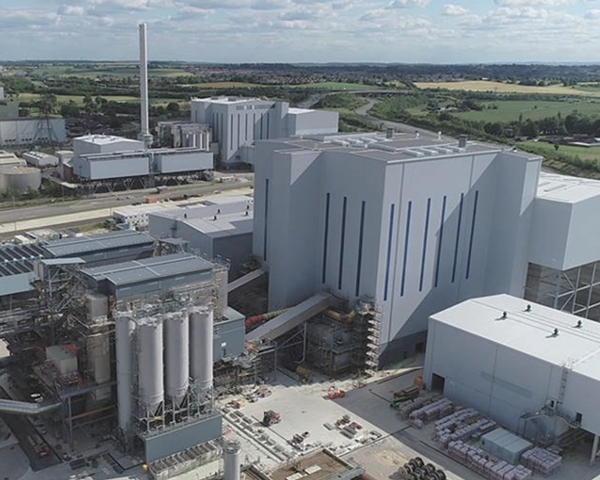
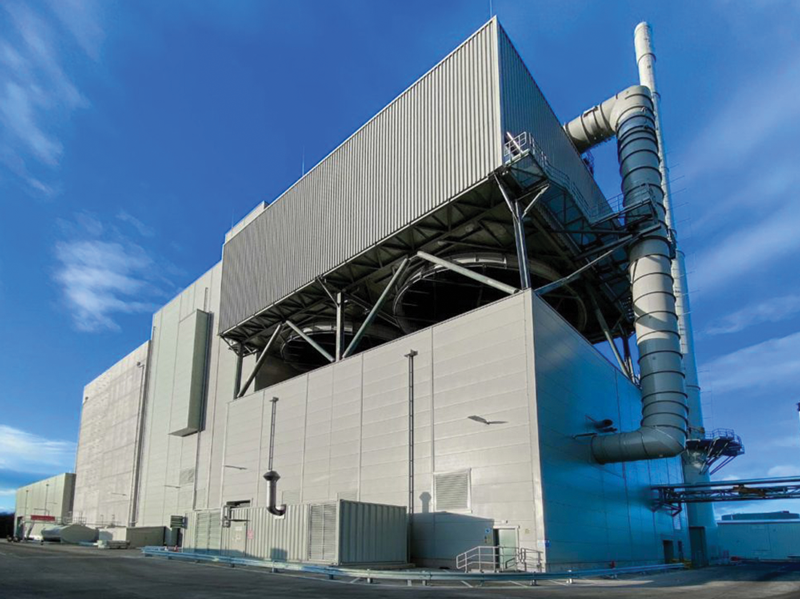
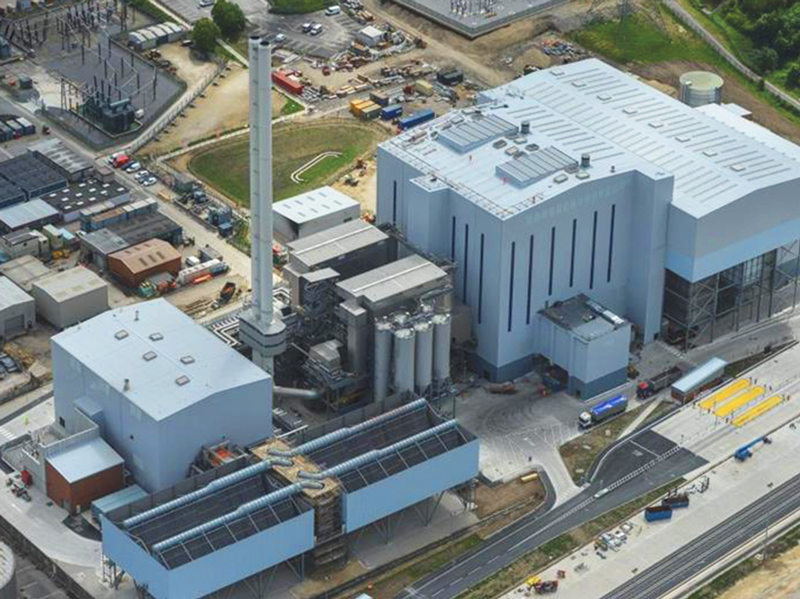
Residual Waste EfW
In WikiWaste, Residual EfW (Energy from Waste) is treated as a distinct infrastructure type within the wider Incineration & EfW category. This page provides a structured view across the national fleet and connects through to individual EfW facility pages and Local Authority disposal routes.
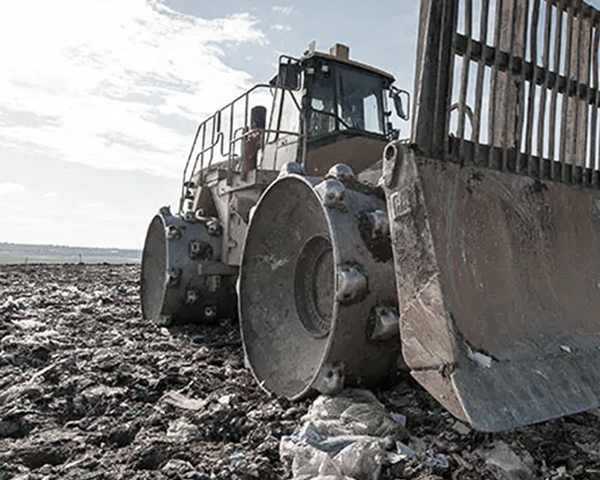
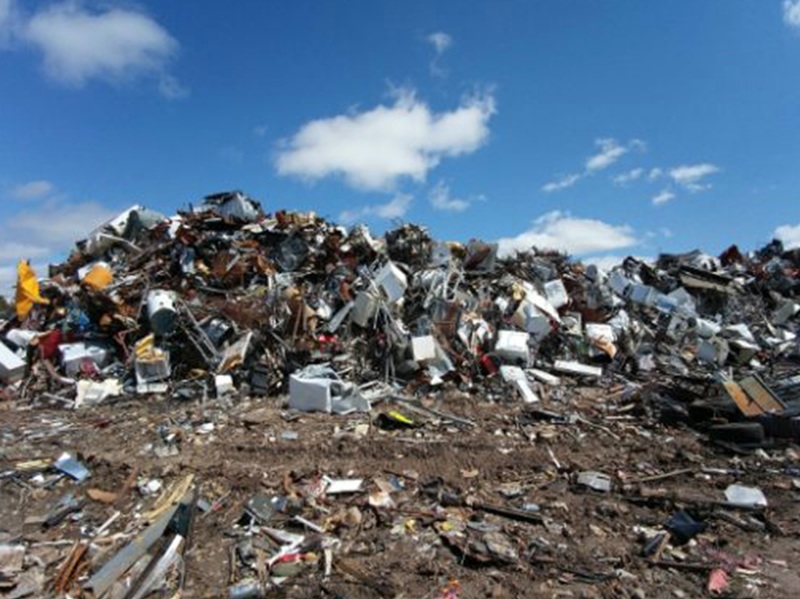
Non-Hazardous Landfill
In WikiWaste, Non-Hazardous Landfill is treated as a distinct infrastructure type within the wider Landfill category. This page provides a structured view of the non-hazardous landfill sites in operation throughout the UK and connects through to individual landfill site pages and Local Authority disposal routes.

UK Key Metrics
A number of Key Metrics are in place throughout the UK that monitor the delivery and performance of policy and legislation and the amount of waste produced, recycled and recovered etc.
This category captures those Key Metrics and links to pages associated with them.

Local Authorities
Each UK Local Authority has its own individual page within WikiWaste, setting out its collection scheme and recycling performance, current arrangements for collections and disposal as well as the key residual and recycling tonnages sent to different infrastructure for treatment.
This page allows the UK to be searched at both country and regional levels and links to each type of authority (County, Unitary, District etc) however this may change as Local Government reorganisation develops.

EWC-STAT Codes
The EWC-STAT codes category groups together the main types of waste used in the UK via their waste descriptions. These codes are also used in national data reports, such as the UK Statistics on Waste.
This allows users to more easily match waste types with facilities listed in WikiWaste and with the amounts of waste reported across the UK. It also makes it easier to link to other regulatory information when needed.
A connected view of the UK waste sector
WikiWaste connects over 1,600 data pages across infrastructure, operators and material flows into a single navigable system. Users can move from facility-level detail to network-level context, linking assets, ownership structures and performance indicators across the UK.
This enables faster analysis, clearer comparisons and more informed strategic decisions.