

Organic Waste
Organic Wastes, as grouped together in WikiWaste, represented around 11 million tonnes (equivalent to around 6%) of the overall waste reported by DEFRA[1] as generated by the UK. However, estimates of food and garden waste arisings by WRAP exceed 23 million tonnes, the difference a result of food and green waste remaining in mixed and residual waste streams, and being disposed of down the sewer or home composted, and therefore not reported.
In addition to unreported Food Waste and Garden Waste, there is an un-reported proportion of agricultural tonnage that isn’t captured in the figures, having been ploughed back into fields.
WikiWaste also captures ‘common sludges’ from the water treatment sector, but this excludes sewage and sewage sludges from households.
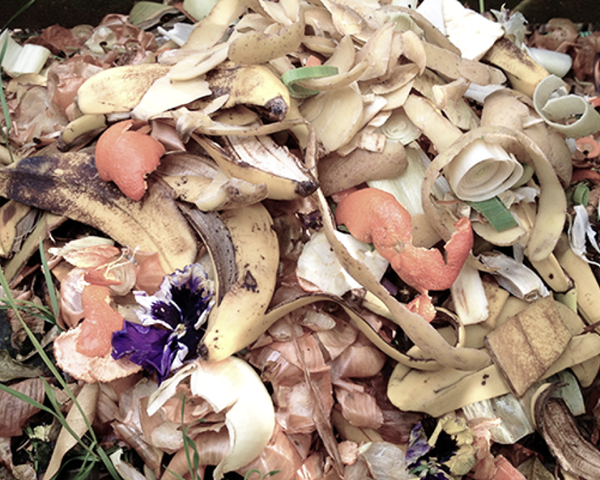
Types within Organic Wastes
Organic Wastes are broken down by EWC-STAT codes in the DEFRA data and grouped in WikiWaste as:
Food Waste
3.8 million tonnes reported as generated (which include Animal Wastes under EWC_STAT Code 9.1). WRAP estimate around 10.1 million tonnes of food waste, of which around 6.0 million tonnes was from households.[2]
1.3 million tonnes were reported as treated, 74% of which went to recovery (except backfilling) and 21% went to incineration with and without energy recovery
Tonnage of food waste is set to increase with the introduction of seprate collection obligations, implimented in England under Simpler Recycling.
Green Wastes
5.8 million tonnes reported as generated (which include Vegetable Wastes under EWC_STAT Code 9.2 ) 70% of which was from households and Green Waste - the balance of 24% from manufacturing.
4.1 million tonnes were reported as treated, 92% of which went to recovery (except backfilling).
Some local authorities collect mixed food and green waste, and where this is the case the tonnage is reported witin the overall tonnages on the Green Waste page.
Common Sludges
1.3 million tonnes reported as generated, 74% from the water collection and treatment sector, 15% from the service sector and 10% from the manufacturing sector (EWC_STAT Code 11). This tonnage on the whole excludes sewage sludge from households.
1.4 million tonnes were reported as treated, 74% of which went to recovery (except backfilling) and 19% were ‘deposited onto or into land’
Around 120 thousand tonnes of animal faeces and manures, primarily from the agricultural sector are not included in the groupings above.
UK Organic Waste Arisings by Waste Category (2020)
Total Organic Waste Arisings 10,897.81 thousand tonnes (2020). Data source: [1]
Organic Waste Arisings by Economic Classification
Economic Classification | UK 2020 | England 2020 | England 2022 |
|---|---|---|---|
Agricultural | 64.97 | 8.35 | 8.17 |
Mining & Quarrying | 0.33 | 0 | 0 |
Manufacturing | 3,131.51 | 2,106.79 | 2,003.66 |
Water Treatment | 996.02 | 807.88 | 811.69 |
Services | 1,820.75 | 1,444.11 | 1,233.80 |
Households | 4,825.03 | 3,908.96 | 3,628.37 |
Construction | 59.20 | 0 | 0 |
Total Arisings | 10,897.81 | 106.30 | 7,685.71 |
England as % of UK | 70.5% |
Organic Waste Arisings by Economic Classification
All figures in thousand tonnes. Data source: [1]
Historical Context
The growth in Composting and Anaerobic Digestion of organic wastes has underpinned around half of local authority recycling performance in the past as landfill tax increased costs and pushed this material up the waste hierarchy.
In addition, subsidies for renewable power encouraged investment in the AD sector.
Potential Increases in Food Waste
The introduction of Simpler Recycling in England and similar initiatives in other countries of the UK requires the separate collection of food waste. (unless a compelling argument can be made against this under TEEEP - in which case it may be collected with green waste and sent for treatment to IVC).
As a result it is likely that food waste collected and sent to AD will increase over the coming years.
Purpose
This category brings together those materials that are organic in nature and are largely treated by Anaerobic Digestion and Composting and in many cases require specific management under Animal By Products legislation. None of these wastes are classified as hazardous waste.
Approach
This category sets out the EWC-STAT codes that are reported and grouped in WikiWaste as Organic Wastes as reported in DEFRA data[1]. Other data sources are also used (specifically that reported by WRAP[2]) that provide a wider perspective on the tonnages generated but not captured in the mixed streams of the DEFRA data.