Non-Hazardous Landfill: Difference between revisions
add table and graph |
mNo edit summary |
||
| Line 2: | Line 2: | ||
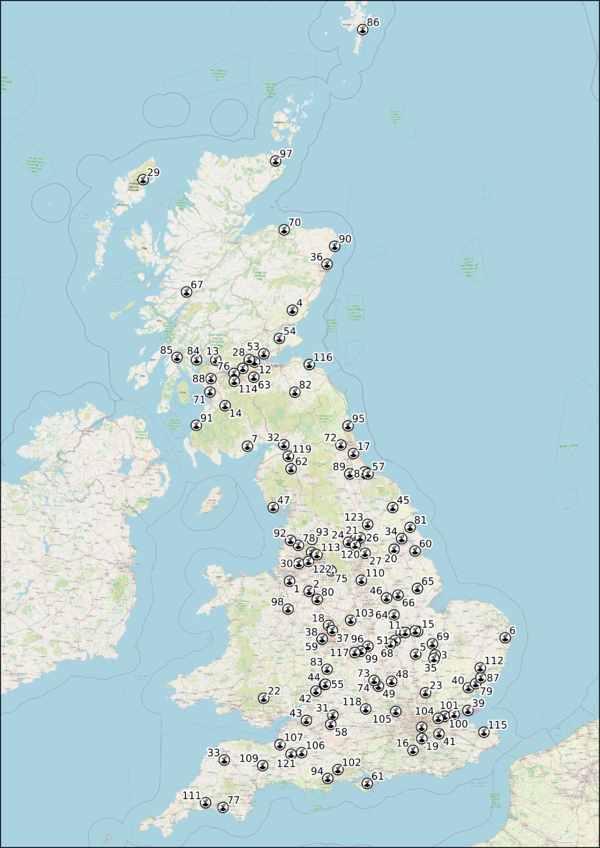
Only a Non-hazardous Landfill can accept [[Non-Hazardous Waste]] which includes [[Municipal Solid Waste]] and any other [[Non-Hazardous Waste]] of a similar nature that meets the relevant [[Waste Acceptance Criteria]]. They can also accept [[Inert Waste]] and [[Stabilised Non-Reactive Hazardous Waste]], for example those vitrified or solidified<ref>Defra, 2010. [https://assets.publishing.service.gov.uk/government/uploads/system/uploads/attachment_data/file/69347/pb13563-landfill-directive-100322.pdf Environmental Permitting Guidance: The Landfill Directive for the Environmental Permitting (England and Wales) Regulations 2010. London: Department for Environment, Food and Rural Affairs], p.7.</ref>. | Only a Non-hazardous Landfill can accept [[Non-Hazardous Waste]] which includes [[Municipal Solid Waste]] and any other [[Non-Hazardous Waste]] of a similar nature that meets the relevant [[Waste Acceptance Criteria]]. They can also accept [[Inert Waste]] and [[Stabilised Non-Reactive Hazardous Waste]], for example those vitrified or solidified<ref>Defra, 2010. [https://assets.publishing.service.gov.uk/government/uploads/system/uploads/attachment_data/file/69347/pb13563-landfill-directive-100322.pdf Environmental Permitting Guidance: The Landfill Directive for the Environmental Permitting (England and Wales) Regulations 2010. London: Department for Environment, Food and Rural Affairs], p.7.</ref>. | ||
==Capacity | ==Capacity Non-Hazardous Landfill== | ||
The capacity of Non-Hazardous Landfill is reported<ref>[https://data.gov.uk/dataset/237825cb-dc10-4c53-8446-1bcd35614c12/remaining-landfill-capacity EA Remaining Landfill Capacity]</ref> by the [[EA]] and is summarised in the graph and table below, but it excludes that capacity of Non-Hazardous Landfill with a Stabilised Non-Reactive Hazardous Waste cell (which comprised 89.4m cubic metres in 2015 dropping to 69.4m cubic metres in 2019 which is summarised on the [[Hazardous Landfill]] page): | The capacity of Non-Hazardous Landfill is reported<ref>[https://data.gov.uk/dataset/237825cb-dc10-4c53-8446-1bcd35614c12/remaining-landfill-capacity EA Remaining Landfill Capacity]</ref> by the [[EA]] and is summarised in the graph and table below, but it excludes that capacity of Non-Hazardous Landfill with a Stabilised Non-Reactive Hazardous Waste cell (which comprised 89.4m cubic metres in 2015 dropping to 69.4m cubic metres in 2019 which is summarised on the [[Hazardous Landfill]] page): | ||
Revision as of 10:27, 30 November 2020
Only a Non-hazardous Landfill can accept Non-Hazardous Waste which includes Municipal Solid Waste and any other Non-Hazardous Waste of a similar nature that meets the relevant Waste Acceptance Criteria. They can also accept Inert Waste and Stabilised Non-Reactive Hazardous Waste, for example those vitrified or solidified[1].
Capacity Non-Hazardous Landfill
The capacity of Non-Hazardous Landfill is reported[2] by the EA and is summarised in the graph and table below, but it excludes that capacity of Non-Hazardous Landfill with a Stabilised Non-Reactive Hazardous Waste cell (which comprised 89.4m cubic metres in 2015 dropping to 69.4m cubic metres in 2019 which is summarised on the Hazardous Landfill page):
| <graph>{
"width":400, "height":200, "data":[{ "name":"table", "values":[ {"x":2015,"y":230.3},{"x":2016,"y":211.9},{"x":2017,"y":194.4}, {"x":2018,"y":185.2},{"x":2019,"y":160.2} ] }], "scales": [ {
"name": "x",
"type": "linear",
"range": "width",
"zero": false,
"domain": {"data": "table", "field": "x"}
},
{
"name": "y",
"type": "linear",
"range": "height",
"nice": true,
"domain": {"data": "table", "field": "y"}
}
], "axes": [ {"type": "x", "scale": "x", "format":"d","title":"Year"},
{"type": "y", "scale": "y", "grid":true, "title":"Million Cubic Metres"}
], "marks": [ {
"type": "line",
"from": {"data": "table"},
"properties": {
"enter": {
"x": {"scale": "x", "field": "x"},
"y": {"scale": "y", "field": "y"},
"stroke": {"value": "steelblue"},
"strokeWidth":{"value":2}
}
}
},
{ "type": "symbol",
"from": {"data": "table"},
"properties": {
"enter": {
"x": {"scale":"x","field": "x"},
"y": {"scale":"y","field": "y"},
"fill": {"value": "steelblue"},
"size":{"value":15}
}
}
} ] }</graph> |
| Year | 2015 | 2016 | 2017 | 2018 | 2019 |
| Tonnes | 230.3 | 211.9 | 194.4 | 185.2 | 160.2 |
Operational Landfill

